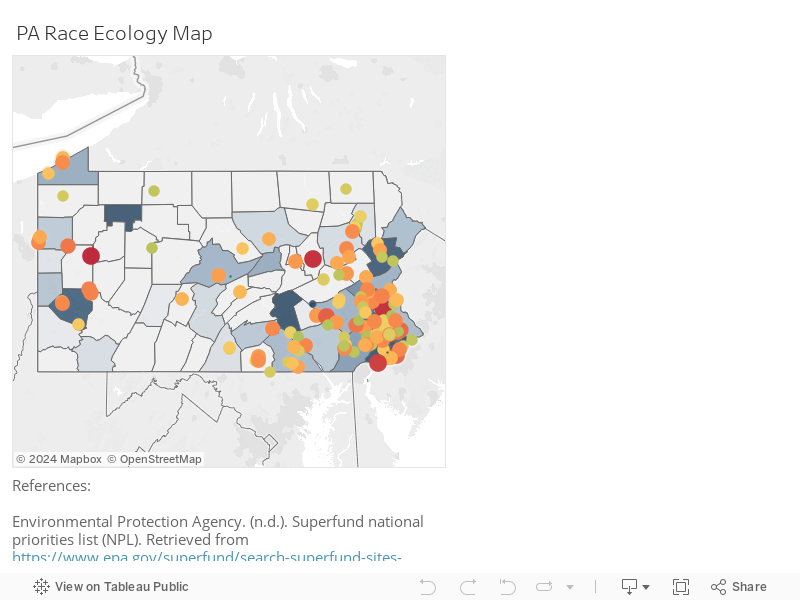


This map is a Data Visualization made for the exhibit Art at the Center: Transdisciplinary Creativity at the Borland Project Space. It overlays the EPA Superfund hazard site data onto the demographic makeup of PA’s counties, indicating a correlation between counties with more minority residents and sites of environmental hazards. Hovering the mouse over the hazard sites yields the EPA dossier on that site.
Best viewed in full screen mode by pressing the button in the lower-right.