


Two different experiments producing physical artifacts generated digitally from statistical data.

The first experiment in data materialization was this Processing ‘data cylinder,’ into which I fed NCES IPEDS data on the demographic makeup of “Digital Arts” undergraduate majors from 2012-2018. The result is a nonagonal prism divided into 5 segments, with each facet representing a different demographic group recorded in the IPEDS data, and each segment along that facet representing an academic year. On each segment is a pyramid the height of which reflects the number of undergraduate “Digital Arts” degrees awarded to members of that demographic group in that year. The result is a 3D timeline object that shows how the discipline has expanded overall during that time, which groups are over- and under-represented in the field, and which groups have seen the most significant expansion over that time.
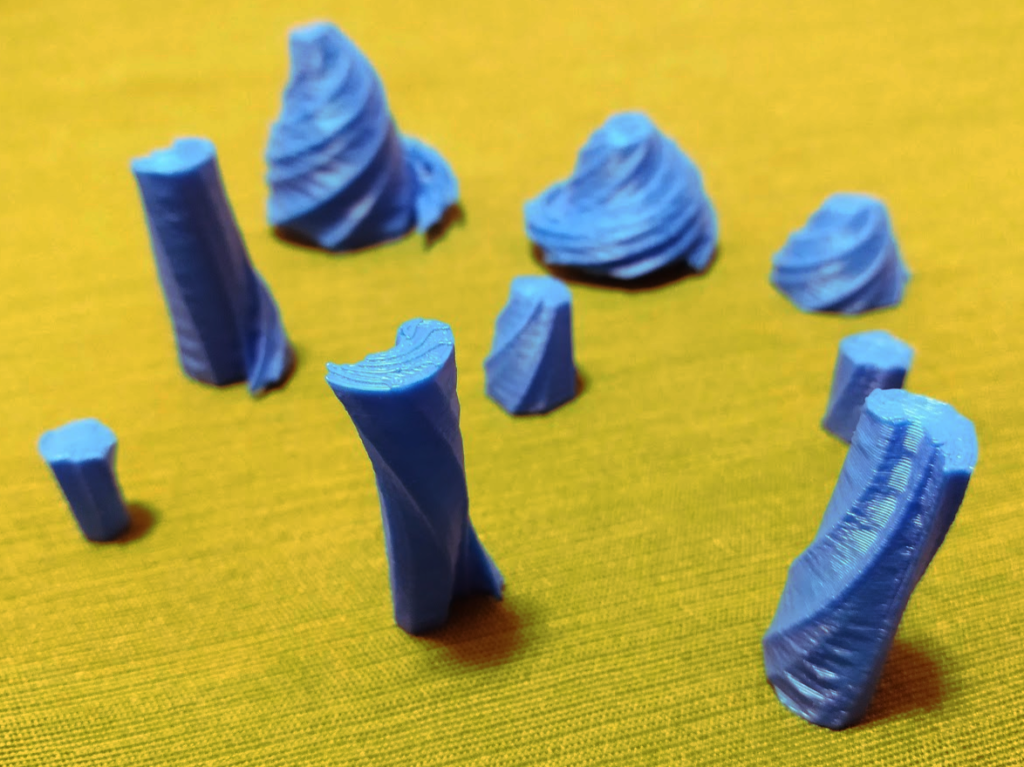
The second experiment in data materialization leveraged the demographic US Census data and EPA Superfund Site data I drew on for my mapping environmental racism project. The fact that I didn’t need to worry about geolocating the data meant I could go finer-grain and use city, rather than county, demographic data. I made a new collated dataset between the EPA data for PA and city-level demographic Census data, and developed a Processing sketch that would randomly pull a site from the list and generate a form from the data.
The width of the base reflects the minority population of the city – wider bases have larger POC populations. The height of the object represents the “lifetime” of the hazard site: either length of time between the superfund hazard site being recorded by the EPA and its case being closed, or the length of time between its inception and today, if the case hasn’t been closed. Shapes that taper reflect closed cases, shapes that do not are still open. Finally, the “twist” distortion of the shape represents the severity of the environmental hazard as scored by the EPA. From this random sampling of nine sites (out of 128), one narrative the objects present is that more severe hazards seem to occur in more minority-populated areas. While the shortest-lived hazard sites in the sample are from white-homogeneous locations, there are also several white-homogeneous locations with long-lived and ongoing hazards.